Quantitative EEG and LORETA
What Is QEEG?
Physical injury to the brain, such as concussion, disrupts normal flow of electrical impulses in the brain tissue. Similarly, toxic injury, seizure disorder, Alzheimer’s disease, anoxia and brain infection (e.g., chronic Lyme encephalitis) alter brainwave activity. ADD, OCD, anxiety, depression and Learning Disability have distinct brainwave “signatures” as well.
EEG (or electroencephalogram) is a recording of brainwave activity. QEEG (Quantitative EEG), popularly known as brain mapping, refers to a comprehensive analysis of brainwave frequency bandwidths that make up the raw EEG. QEEG is recorded the same way as EEG, but the data acquired in the recording are used to create topographic color-coded maps that show electrical activity of the cerebral cortex.
While other brain imaging techniques (e.g., CT, MRI, PET, SPECT) measure such properties as cerebral blood flow, metabolism or structural integrity, QEEG measures electrical activity of the brain. It provides complex analysis of such brainwave characteristics as symmetry, phase, coherence, amplitude, power and dominant frequency.
LORETA (Low Resolution Electromagnetic Tomography Analysis) allows viewing of 3-dimentional electrical current sources in the brain. It uses data obtained in the QEEG recording and employs standard MRI atlas images with anatomical Talairach coordinates for 3-dimentional gray matter modeling.
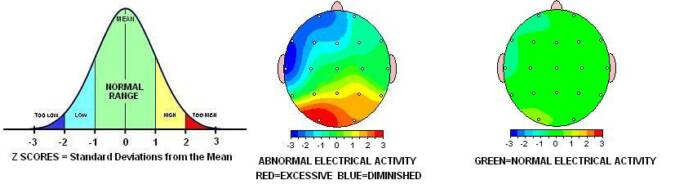
The QEEG and LORETA findings are then compared to a normative database. This database consists of brainwave recordings of several hundred healthy individuals. Comparisons are displayed as Z scores, which represent standard deviations from the norm.
How Is It Done?
An elastic cap with 20 sensors is placed on the head and the sensors are connected to the recording device. A special conductive gel is squeezed into each of the 20 sensors in the cap. This preparation takes approximately 15 minutes. The actual recording takes from 5 to 10 minutes. You may be instructed to keep your eyes open or closed during parts of the recording, or asked to perform a mental task, such as reading or math.
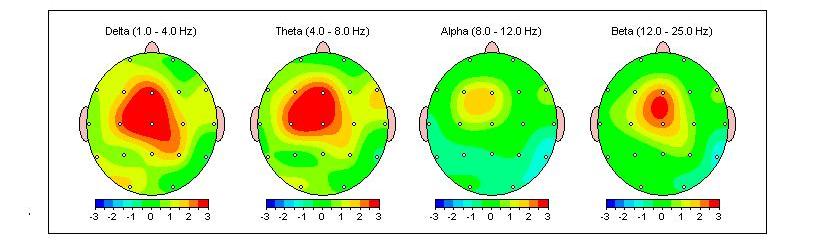
Reading The Maps
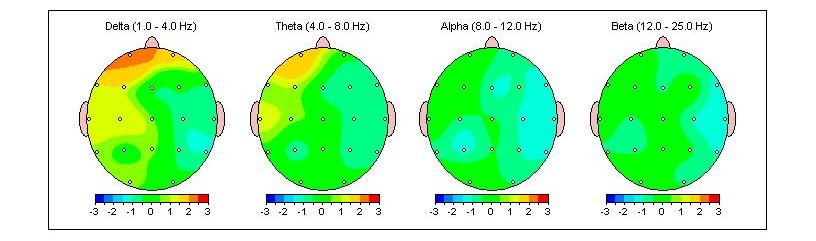
The QEEG results are displayed as Z scores, which represent standard deviations from the mean and span from –3 to +3. E.g., a Z score of +2 means that the result is 2 standard deviations higher than the norm. A Z score of 0 represents the norm and is color-coded green. Red and blue colors on the maps show extreme brainwave activity that is 3 SDs above or below the norm. It is important to know that when it comes to brainwave activity, more does not mean better. Both excessive and diminished activity may be equally problematic.
The following examples show different ways in which QEEG and LORETA can be useful in diagnostics and treatment, as well as evaluation of treatment effectiveness.
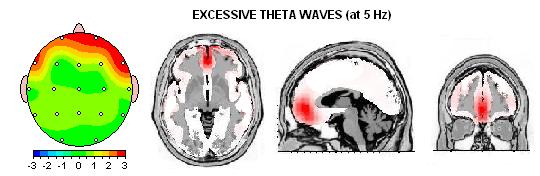
► Example 1. This 14-year-old boy exhibits a typical ADD signature: excessive slow waves in the Frontal lobes.
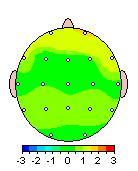
The same patient after 25 Neurofeedback sessions has a much more normal brainwave
pattern as well as symptom reduction and improved school performance. The
map allowed Neurofeedback treatment to be applied precisely where it was needed.
Repeating brain mapping after the treatment clearly showed its effectiveness.
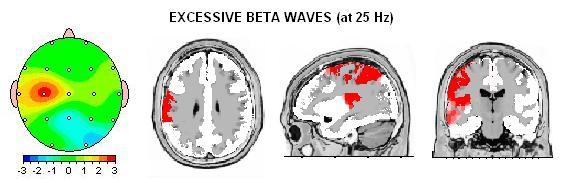
► Example 2. This 28-year-old man was injured in a car accident. Excessive focal Beta waves are seen in the left Fronto-Parietal area due to traumatic brain injury (TBI). Interestingly, the CT scan performed at the ER showed no abnormality.
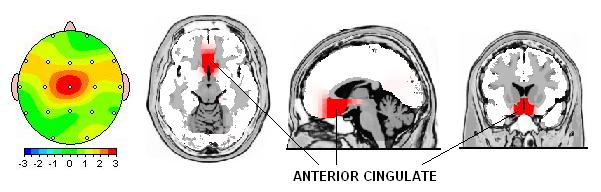
► Example 3. LORETA analysis of this very anxious patient revealed that the source of abnormally elevated Beta activity seen in her QEEG was beneath the cortical surface, in the Anterior Cingulate, which is part of the Limbic System. This pattern is often found in individuals suffering from Anxiety, Depression, Obsessive Compulsive Disorder (OCD) and other emotional disorders.
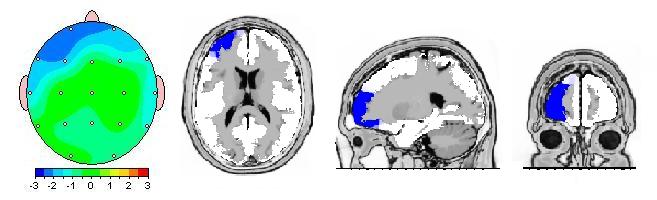
► Example 4. Another common finding in individuals suffering from depression is diminished activity in the left pre-frontal area of the brain.
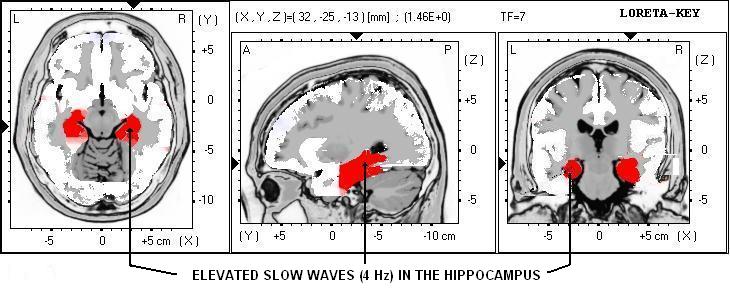
► Example 5. Excessive slow wave activity visualized in both Hippocampi was present in this 68-year-old man who was recently diagnosed with Alzheimer's disease.
► Example 8. This motley appearance of diminished activity (blue color) was recorded in a patient with chronic Lyme encephalopathy (brain Lyme). The infection causes vasculitis (inflammation of blood vessel walls) and restricts blood flow and oxygen supply in the brain. The MRI of this patient showed multifocal lesions.
► Example 9. A young man with mild symptoms of ADD exhibits moderately elevated slow waves in the left Frontal area.
Here is his QEEG 45 minutes after he took 20 mg of Ritalin. Although "revving up" his brainwave activity made him feel better (more focused, alert and energetic), this came at a "price" of highly abnormal brainwave patterns which might cause significant problems in the long run.
► Example 10. These are two QEEG recordings of a young man suffering from ADD made 2 weeks apart. The one on the left shows elevated slow wave activity (red color) in the Frontal lobes, commonly seen in individuals with ADD. The one on the right was made 2 hours after he had smoked marijuana, which, he thought, helped him cope with his ADD symptoms. It clearly shows that smoking marijuana significantly increased his already elevated slow waves (red color in the first 2 rows) and diminished his fast waves (blue color), which adversely affected his ability to focus and think.